
Professional Features
Unlock the full potential of GPRviewer with the Pro license.
20 advanced tools for analyzing and interpreting your radar data.
Free vs Pro Comparison
| Feature | Free | Pro |
|---|---|---|
| Basic Visualization | ||
| Open .DZT files (GSSI) | ✓ | ✓ |
| Colormaps (12 palettes) | ✓ | ✓ |
| Zoom x0.25 to x4 | ✓ | ✓ |
| Real-time A-scan display | ✓ | ✓ |
| Basic PNG export | ✓ | ✓ |
| Depth calibration | ✓ | ✓ |
| Dielectric constant adjustment | ✓ | ✓ |
| Dual-frequency GPR compatible (Utilityscan DF, FLEX NX) | ✓ | ✓ |
| Background noise removal | ✓ | ✓ |
| Depth cropping (vertical trim) | ✓ | ✓ |
| Analysis Tools | ||
| 📌 Rebar picking (automatic stats) | ✗ | ✓ |
| 📏 Distance measurement | ✗ | ✓ |
| ⌒ Hyperbola fitting | ✗ | ✓ |
| 〰 Interface tracing | ✗ | ✓ |
| ✏️ Drawing and annotation tools | ✗ | ✓ |
| Signal Processing | ||
| ± Polarity inversion | ✗ | ✓ |
| 📈 Manual gain on A-scan | ✗ | ✓ |
| 📐 Exponential depth gain | ✗ | ✓ |
| 🎛️ FFT frequency filters | ✗ | ✓ |
| 🔬 Deconvolution (sharper echoes) | ✗ | ✓ |
| ✂️ Horizontal cropping | ✗ | ✓ |
| 🔗 File assembly | ✗ | ✓ |
| 🌀 FK Migration | ✗ | ✓ |
| ↔️ Reading direction reversal | ✗ | ✓ |
| 🔀 V1/V2 channel fusion | ✗ | ✓ |
| Advanced Features | ||
| 🎯 AI rebar picking (one click) | ✗ | ✓ |
| 📊 C-Scan (plan view) | ✗ | ✓ |
| 📶 Noise level (Signal Floor) | ✗ | ✓ |
| 🧊 3D multi-profile view | ✗ | ✓ |
| 🗺️ GPS map profile visualization | ✗ | ✓ |
Pro Features Details
Rebar Picking
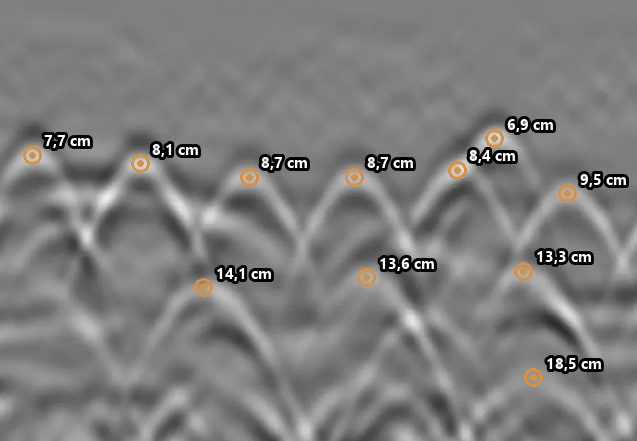
Place measurement points on rebar hyperbolas to automatically obtain comprehensive statistics.
- Min / max / average depth
- Rebar spacing
- Raw data CSV export
- Multi-file global statistics

Distance Measurement
Measure the distance between any two points on the radargram with real-time display.
- Precise distance between two points
- Display in centimeters
- Measurement line visible on export
- Multiple successive measurements

Hyperbola Fitting
Overlay a theoretical hyperbola on your data to estimate propagation velocity and validate depth.
- Interactive velocity adjustment
- Automatic depth calculation
- Dielectric constant display
- Curve overlaid on radargram

Interface Tracing
Manually trace geological or structural interfaces and obtain thickness statistics.
- Point-by-point or continuous tracing
- Thickness statistics (min/max/avg)
- Exportable interface profile
- Thickness graph visualization

Drawing Tools
Annotate your radargrams with professional drawing tools for your reports.
- Lines, rectangles, ellipses
- Custom arrows and text
- Configurable colors and thicknesses
- Annotations visible in PNG export

Polarity Inversion
Invert signal polarity to better visualize certain interfaces or anomalies.
- Instant inversion
- Improved contrast on certain materials
- Reversible at any time


Manual A-scan Gain
Interactively adjust gain directly on the A-scan trace for fine control.
- Point-adjustable gain curve
- Real-time preview
- Applied to entire profile


Exponential Gain
Apply exponential depth gain to compensate for natural radar signal attenuation.
- Adjustable attenuation coefficient
- Automatic energy loss compensation
- Uniform visualization across all depths


FFT Frequency Filters
Apply vertical FFT filters to remove noise and improve data readability.
- Low-pass filter (HF noise removal)
- High-pass filter (dewow removal)
- Combined band-pass filter
- Presets by antenna type (2.6GHz, 900MHz, DF...)
- Deconvolution: sharper echoes, close reflectors separated


FK Migration
Apply Stolt migration (FK) to focus hyperbolas and reposition reflectors to their true position.
- Diffraction hyperbola focusing
- Geometric target repositioning
- Adjustable migration velocity
- Lateral resolution improvement


Direction Reversal
Reverse the profile reading direction to match your acquisition or report direction.
- Instant horizontal reversal
- Match with site plan
- Reversible at any time


AI Rebar Picking
One click: the AI picks every rebar in the profile, with the position and depth of each bar, ready for cover statistics.
- Apex of every hyperbola found automatically
- A few seconds per file, computed on our servers
- Picks editable like manual picks
- Model trained by MDS on nearly 4,000 real hyperbolas, continuously improved
- Also available for your own software: AI Picking API
C-Scan (Plan View)
Generate plan views (C-Scan) from multiple grid profiles to visualize the horizontal distribution of targets.
- Horizontal slice at defined depth
- Automatic profile assembly
- Interpolation between profiles
- Plan map export

Noise Level (Signal Floor)
View the radar signal noise level in real time to assess acquisition quality and detect interference.
- Noise level curve per trace
- Min / max / average statistics
- Detection of disturbed zones
- CSV export of measured values

GPS Map Profile Visualization
View your radar profiles directly on a GPS map to precisely locate anomalies.
- GPS data integration
- Profile display on base map
- Base map overlay
- Georeferenced export
