Open a .DZT or .nx file, process the signal, pick the rebars and produce your report. Nothing to install, on any computer.
19,7 cm
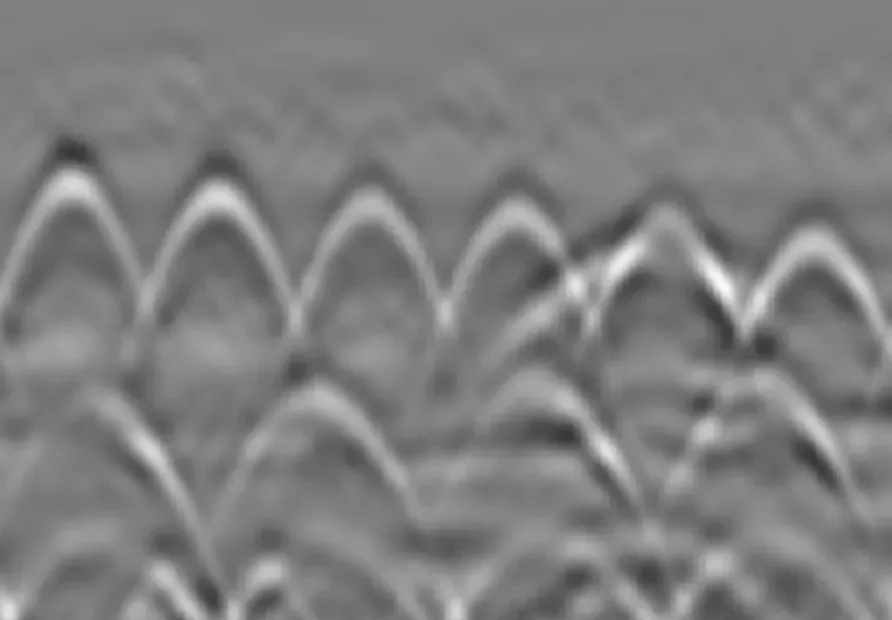
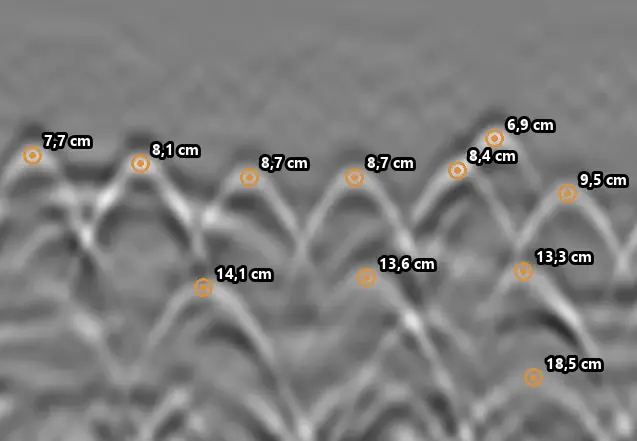
AI Picking, measurement and hyperbola on a real survey: reinforced concrete slab, StructureScan Mini XT
From simply viewing a profile to mapping a rebar mesh.
Read your profiles right away, with the settings that matter.
Measure and document what the radargram shows.
Bring out the reflections that matter.
The AI finds the apex of each hyperbola and snaps it to the signal. You correct where needed and the statistics update.
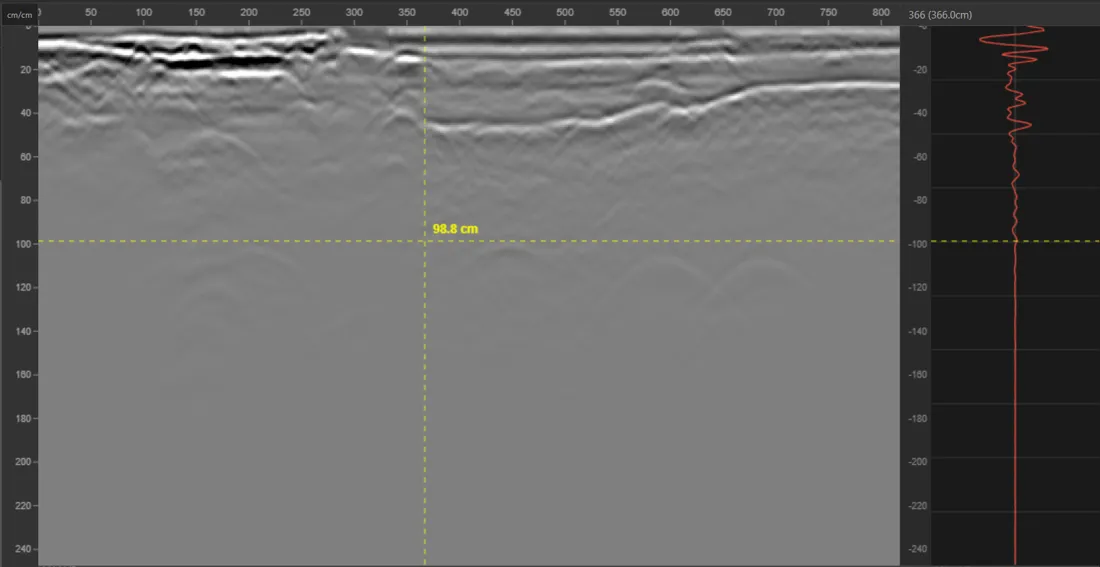
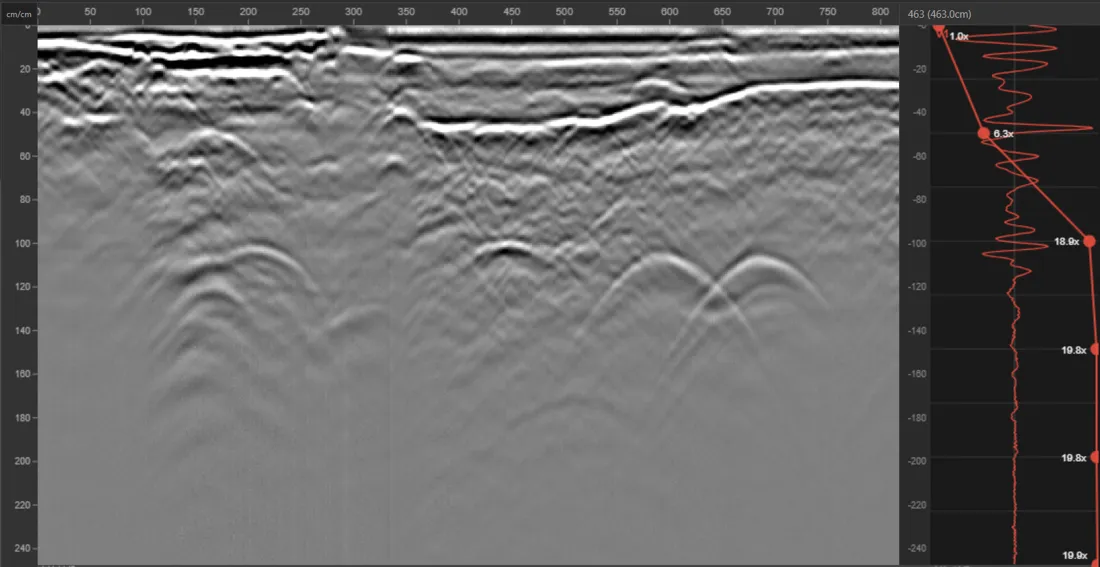
Gain brings up the deep reflections, migration collapses each hyperbola to the true position of the rebar. Drag the slider to compare.
BeforeAfter
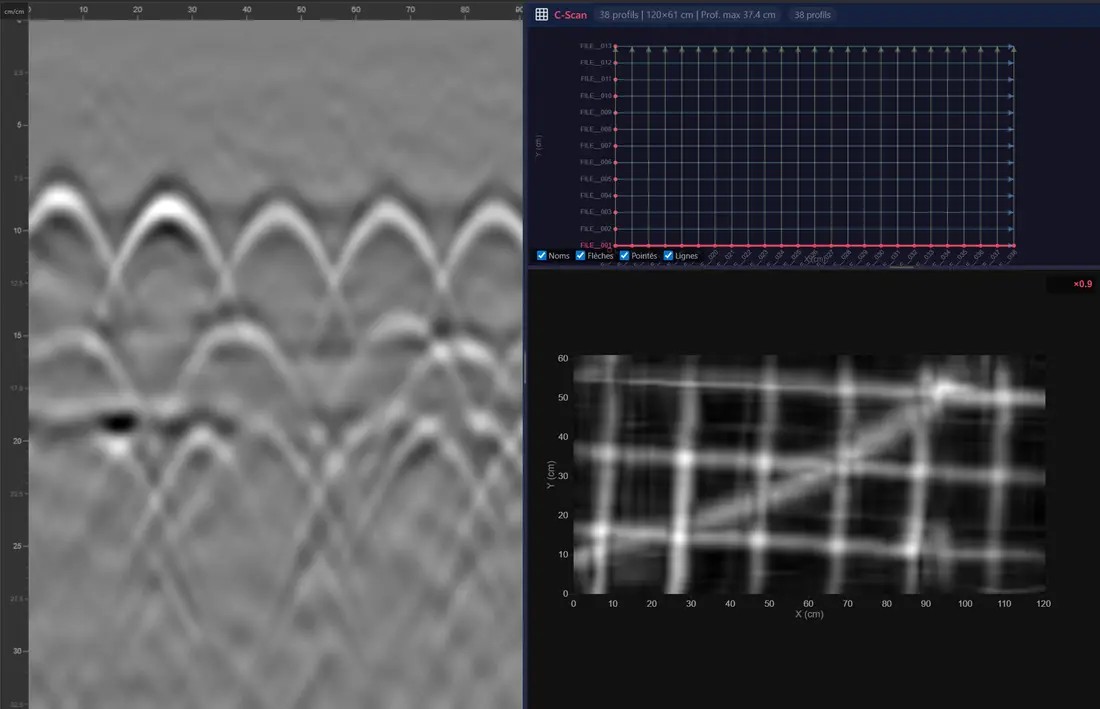
Assemble the passes of a grid and read the rebar mesh or the utilities as on a drawing, slice by slice.
Drop your .DZT or .nx files into the browser. One profile or a whole survey at once.
Filters, gain, migration, then manual or AI picking, interfaces and annotations.
Annotated images, CSV tables, DXF drawings: everything the report needs.


The MDS team shows you the software on real surveys and answers your questions. Sign up for the next session.
Send a radar file, get back the position and depth of every rebar. Billed per metre of profile, with 200 m of free trial.
Discover the APIPOST /api/v1/rebars
file: profil.dzt
{ "rebars": [
{ "x_m": 0.42, "depth_mm": 77 },
{ "x_m": 0.61, "depth_mm": 81 }
] }
No. GPRviewer runs in the browser. A desktop application that works offline is also available for Windows.
No. No radar file is kept on our servers: your surveys stay on your computer.
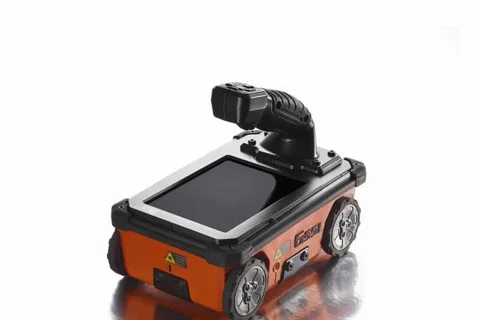
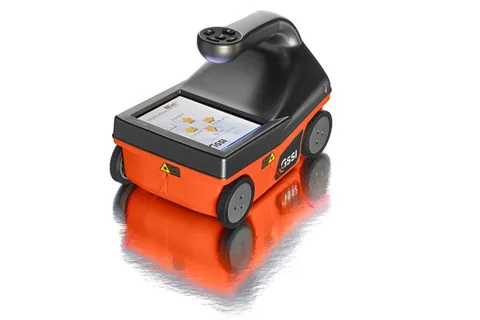
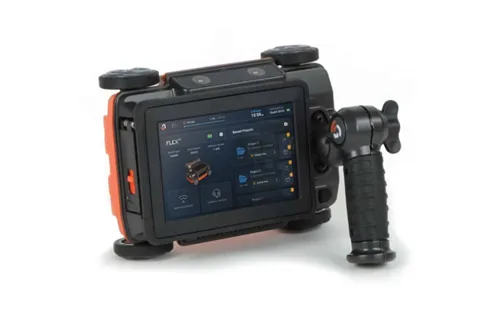
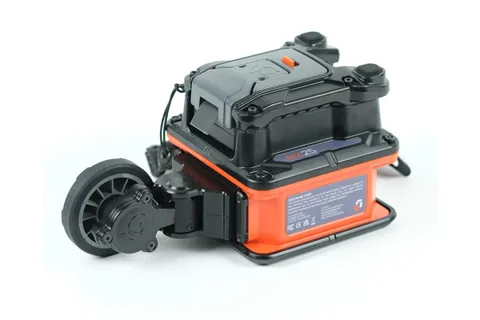
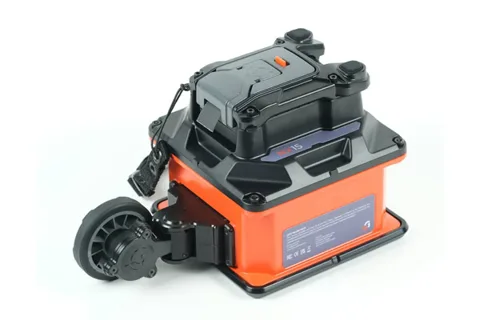
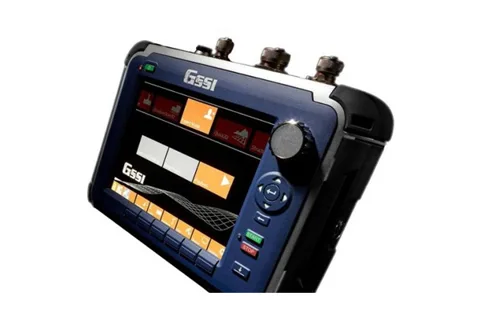
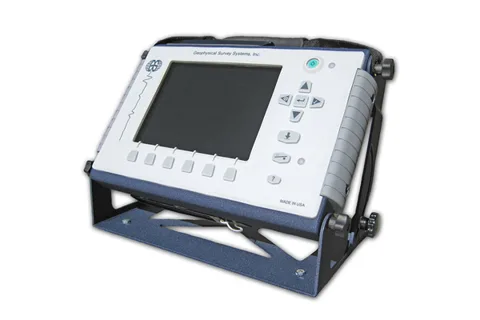
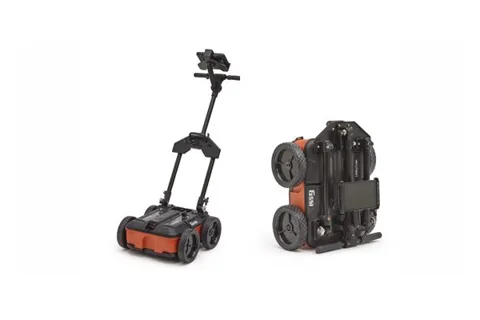
.DZT files from GSSI control units and antennas (SIR 3000, SIR 4000, StructureScan Mini XT, UtilityScan, UtilityScan DF) and .nx files from Compass / Flex NX.
Free lets you open, adjust and export a profile. Pro adds the analysis tools, signal processing, AI Picking, C-Scan and 3D. See the comparison
A free account is enough to view your files.